Helicopter view of how it works:
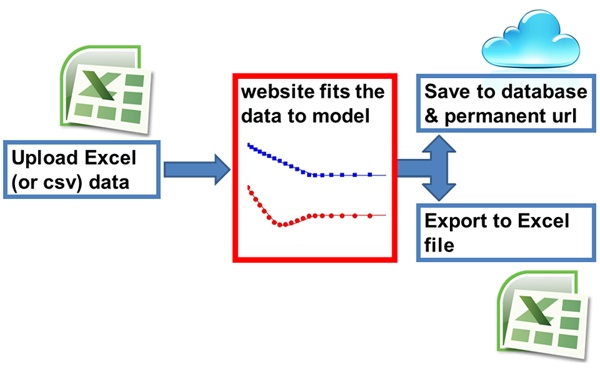
What will the calculator (Bindfit) do?
The calculator which we call Bindfit is designed to work with classical supramolecular titration data obtained from NMR, UV, Fluorescence and other methods (see c.f. P. Thordarson, Chem. Soc. Rev., 2011, 40, 1305-1323 – Link). Bindfit is an example of "APPS" within the broader Open Data Fit project.
- At the top of the page you will see three tabs "Control", "Results" and "Save" to the left and two on the right "Fit" and "Molefraction".
- Prepare your excel input file. See example input files here for UV/Fluorescence (UV1to1 and NMR (NMRt1o1). Excel 2010 (xlsx), Excel 2007 (xls) and CSV (csv) are all accpetable as long as the first (active) worksheet contains the data in the correct format. The first row has the headers, the first two columns are the host and guest concentrations and the remaining columns are your data – which can be anything between 1 – XXX of signals/wavelengths (e.g. just one proton resonance, three proton resonances, one UV wavelength or the entire spectra between 300-700 nm at 1 nm resolution. For UV and Fluorescence data we don’t recommend large regions of spectra where the signal intensity stays close to zero throughout the entire titration.
- IMPORTANT – copy/paste the data ONLY from you correctly formatted excel file to a new excel file (or csv) and save this file. See video below if you are unsure or are getting strange errors (doesn't seem to be as much trouble with the new python site).
- If you don’t do this there is a risk that “hidden” information such as deleted cells in your “old” excel will then interfere with how our program extract the data from the Excel file and the program will the crash or give non-sense results (again - not as much of a problem with our new site).
- In the "Control" tab, press "Choose Fitter" and select the appropriate binding model (or save data only to save data without fit).
- Upload your excel spreadsheet by pressing the "Upload input file" bar.
- N.b. if you selected "save data only" you will now proceed dirctly to "save" in step 19 below.
- If successful, the "Fit" tab should show your raw data.
- Change the initial guess for your binding constant(s) just below the upload bar if you wish to do us.
- For UV-Vis (or Fluorescence) data where the concentration of the host are not constant, hit "correct for dilution" NOT required for NMR.
- Hit the "Fit" bar. "Fit" will change to "Fitting"
- Wait for the calculations to run. Usually less than 3-5 seconds.
- When they are finished the "Fit" bar changes from "Fitting" to "Recalculate Fit" (e.g. if you want to try agan with a different initial guess or model).
- The "Fit" tab or graph will now show the fitted binding isotherm and below that the all important "residual" plot. If you click on the "Molefraction" tab on the right you will also see how the molefraction of the different species change through your titration.
- If you click now on the "Results" tab you will see all the key results with the binding contants first at the top. We will post more information about this later
- Take a look at the output in the "results" tab (and the residual plot).
- Iterate with a new initial guess if you think this is required.
- If you now click on "Save" you save and/or export your data.
- First you see a number of optional field that you can put some (meta)data in.
- At the bottom you see two bars "Save" and "Export".
- Hitting "Export" will then transform that one quickly to "Download". Hitting download again will download an excel file with all the outputs. This process can take a couple of seconds. We will poster later more info on how to interpret the results from that excel file.
- Clicking on "Save" on the other hand will store your data and results in a cloud-based database with an unique URL entry. You will "Save" change to "Link to saved fit"
- The program has now saved your data and result to cloud-based database linked to an unique URL. You will see this URL directly below the "Link to save fit". Copy paste it somewhere for storage (e.g. word or excel table). You can also click on the "Link to save fit" - your browser should then open up a new tab with your database entry. See this example here:
- http://app.supramolecular.org/bindfit/view/8a860975-81e0-4251-b7b3-bf18fa300425
- If you do that you will now see all your input data, your results and all the additional info you entered. You can also edit the fit (this will create a new unique URL) or download the results in an excel file.
- Do make sure to keep you URL info. Once you close your browser you cannot retrieve your database entry without with our current configuration (we will change this in the future.
- Don’t forget – this is a program – it calculates results based on inputs. You still need to analyse the results and see for instance if they make any physical/real sense.
Search
Recent Tweets
-

OpenDataFit (Palli) @opendatafit
Yah! We have just submitted our abstract. Plus Douglas Vander Griend, Amar Flood and Pall Thordarson also planning… https://t.co/B40dtKLZHj
2 years, 4 months ago -

Palli Thordarson @PalliThordarson
OpenDataFit (Palli)
The problem with overfitting / "unnecessary complicated models" is something I dealt with a lot re binding constant… https://t.co/wpFqIFAZjc
2 years, 4 months ago -
Palli Thordarson @PalliThordarson
OpenDataFit (Palli)
@RACInational Draft submission for the @arc_gov_au review, a 🧵 Draft below for #ozchem to use as basis for your own… https://t.co/nMmX3Nqo6M
2 years, 6 months ago

